The continuous automated data collected from the Sky Quality Meter (SQM) included temperature.
Although temperature is just one element which affects climate it can be used to show the effect it can have on dawn and isha times.
Impact on Dawn:
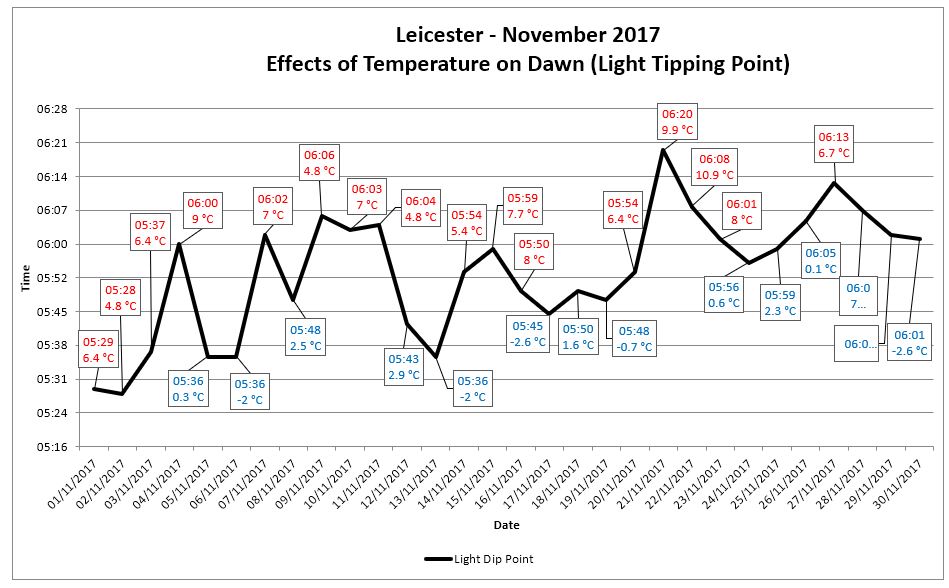
The following graph shows the tipping point for November 2017.
[Click Image to Expand]
During the month the tipping points varied between 5:28AM GMT and 6:20AM GMT. When daily tipping point is compared with the temperature there is a strong correlation between two; the higher the temperature the later (closer to sunrise) the dawn tipping point is.
Impact on Isha:
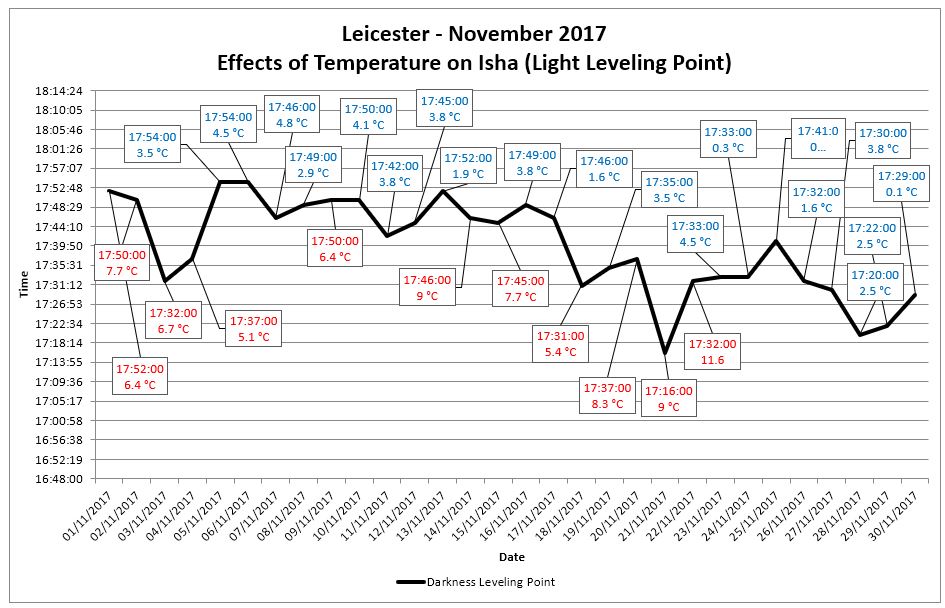
The following graph shows the levelling point for November 2017.
[Click Image to Expand]
During the month the light levelling point varied between 17:16 GMT and 17:54 GMT. When daily leveling point is compared with the temperature there is a strong correlation between two; the higher the temperature the closer to sunset the Isha leveling point is.
Global Warming:
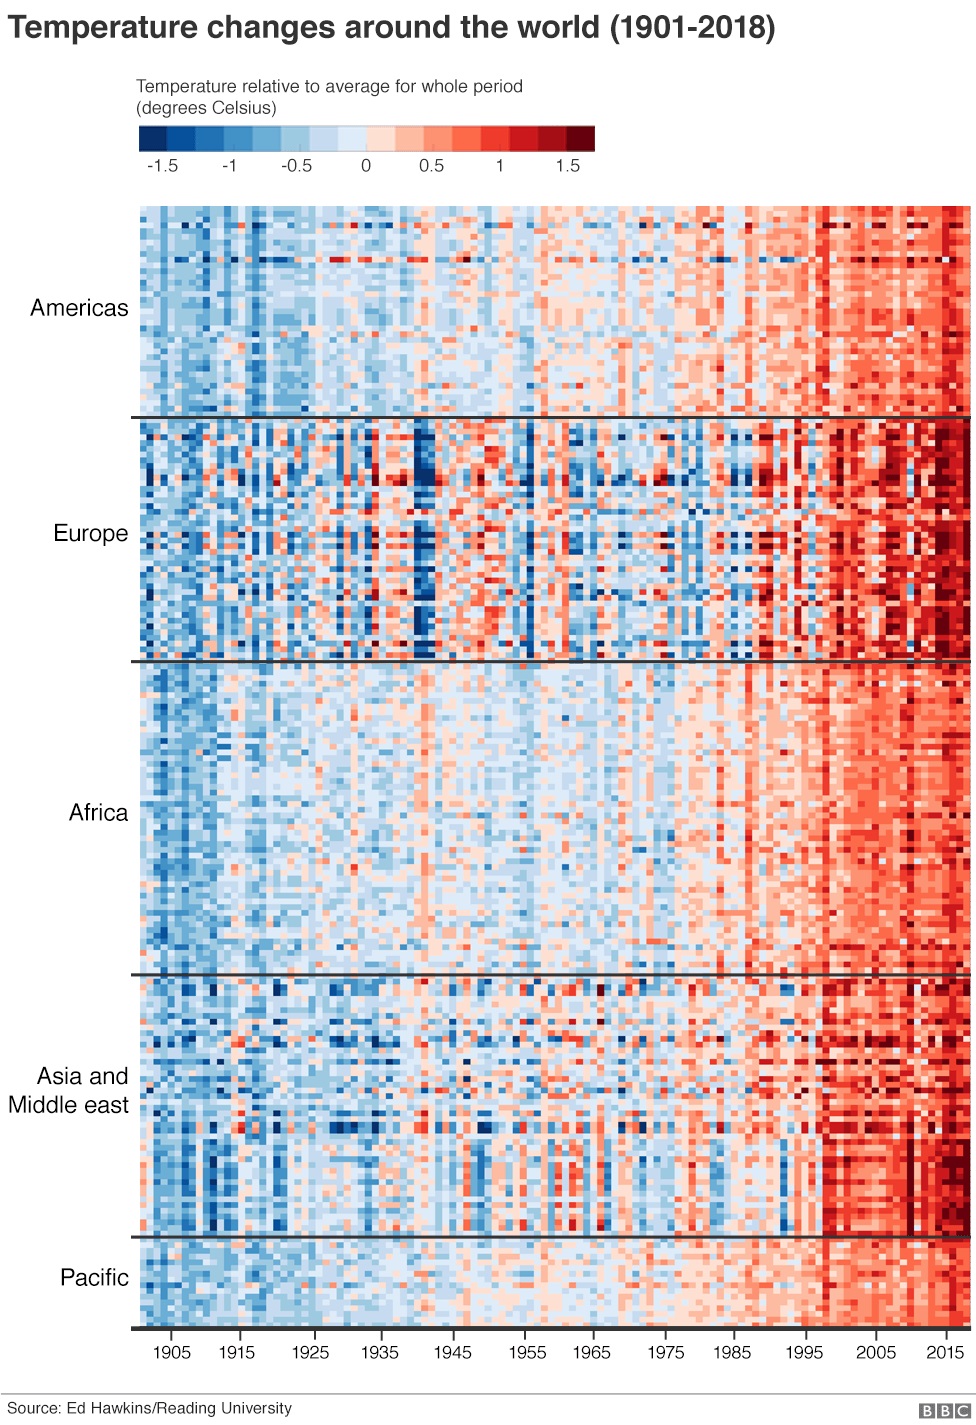
A BBC report published in 2019 explored the global temperature changes across the continents over the last 100 years.
The following climate strip diagram illustrates the changes:

The argument for the use of 18° by many today is based on observations and studies some now 100 years old.
The SQM data illustrates the impact temperature can have on both Dawn and Isha. With the Earth now warmer, it is a fair assumption that even in locations where historically dawn was observed at 18°, today may result in a very different observations due to global warming.
The warmer the morning, the later (closer to sunrise) dawn is.
The warmer the evening, the earlier (closer to sunset) Isha is.


